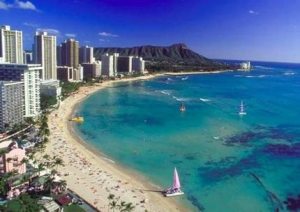
Hawaii Tourism set new records last year
HONOLULU, Hawaii – “Hawaii Tourism Authority’s marketing programs drive travel demand for Hawaii, but it’s the warmth and aloha of our people throughout the islands that keep them coming back,” said Hawaii Tourism Authority (HTA) President and CEO George D. Szigeti, commenting on total visitor data for 2017 released today.
For the sixth consecutive year, Hawaii’s tourism industry in 2017 achieved new annual record totals in five key categories, visitor spending, generated tax revenue, visitor arrivals, trans-Pacific air seats serving Hawaii and jobs supported statewide, according to preliminary year-end statistics released today by the Hawaii Tourism Authority.
Visitors to the Hawaiian Islands spent $16.78 billion [1] in 2017, an increase of 6.2 percent from the previous record in 2016. Spending by visitors generated a record $1.96 billion in state tax revenue in 2017, an increase of $114.76 million (+6.2%) over 2016.
Additionally, a record 204,000 jobs [2] statewide were supported by Hawaii’s tourism industry in 2017 an increase of 5.2 percent over 2016.
A total of 9,382,986 visitors came to Hawaii in 2017, surpassing the 2016 record of 8,934,277 visitors by 5 percent. Total visitor days [3] rose 4.7 percent from a year ago. On average, there were 230,113 visitors in the Hawaiian Islands on any given day in 2017, up 5 percent versus 2016.
Arrivals by air rose 4.9 percent to 9,256,761 visitors in 2017, driven by growth from U.S. West, U.S. East, Japan and Canada. Arrivals by cruise ships also increased (+12.2% to 126,225 visitors) with 12 more tours from out-of-state cruise ships compared to 2016.
All four larger Hawaiian Islands realized growth in visitor spending, visitor days and arrivals in 2017 compared to last year. The island of Hawaii recorded the largest increases of all the islands in visitor spending (+14.7% to $2.40 billion), visitor days (+11.2%) and arrivals (+13.7% to 1,762,914) in 2017 compared to 2016, supported by increases in direct air service from U.S. and Japan markets. Visitor spending on Oahu rose 3.9 percent to $7.63 billion, boosted by the growth in visitor days (+3.6%) and arrivals (+4.1% to 5,672,123). Visitor spending on Maui gained 5.2 percent to $4.76 billion, visitor days rose 2.9 percent, and arrivals were up 4.1 percent to 2,742,108 visitors. Visitor spending on Kauai grew 9.6 percent to $1.83 billion, bolstered by growth in visitor days (+5.5%) and arrivals (+7.5% to 1,276,803).
A record total of 12,235,608 trans-Pacific air seats (+1.8%) serviced the Hawaiian Islands in 2017. Growth in air seats from U.S. East (+9.2%), Japan (+8.3%) and Other Asia (+0.7%) offset fewer seats from Oceania (-6.1%). Total air seats from U.S. West and Canada were similar to 2016.
For the month of December 2017, visitor spending rose 2.9 percent to $1.63 billion. Total visitor days (+4.9%) and arrivals increased (+6.3% to 880,441) but the average daily spending by each visitor was lower (-2% to $196 per person) than in December 2016.
Other Highlights
U.S. West: Total visitor spending gained 9.7 percent to $6.18 billion in 2017. Arrivals increased (+4.9% to 3,843,208) with growth in visitors from both the Mountain (+6.4%) and Pacific (+4.3%) regions. Daily spending averaged $177 per person in 2017, up from $168 per person in 2016. Lodging, food and beverage, entertainment and recreation, and shopping expenses were all higher compared to last year. There was moderate growth in hotel (+5.9%) and timeshare (+3.4%) stays by visitors, while stays in rental homes (+12%) and bed and breakfast properties (+11.1%) rose significantly compared to 2016.
In December 2017, both visitor spending (+9% to $614.3 million) and visitor arrivals (+6.8% to 360,956) increased versus December 2016.
U.S. East: Visitor spending rose (+9.5% to $4.26 billion) in 2017 compared to last year, bolstered by a 5.6 percent growth in arrivals to 1,998,650 visitors. Arrivals increased from every U.S. East region, highlighted by growth from the two largest regions, South Atlantic (+7.5%) and East North Central (+4.8%). Daily spending (+4.7% to $211 per person) was also higher compared to 2016, due to increases in lodging, food and beverage, shopping, and entertainment and recreation expenses. Substantially more visitors stayed in bed and breakfast properties (+14.3%) and rental homes (+12.7%) compared to a year ago.
In December 2017, visitor spending increased 3.1 percent to $433.1 million with arrivals also up 4 percent to 192,338 visitors.
Japan: Visitor spending rose 5.8 percent to $2.22 billion in 2017. Arrivals grew 5.4 percent to 1,568,609 visitors, supported by the launch of direct air service to Kona in December 2016 and increased air service to Honolulu. However, daily spending has been down for four consecutive months since September 2017, resulting in a slight drop for the year compared to 2016 (-1% to $238 per person). Expenses for lodging and entertainment and recreation were similar in 2017 to 2016, but shopping expenses decreased. Significantly more visitors stayed in condominiums (+23.1%) and timeshares (+19.1%) in 2017 compared to last year. More visitors made their own travel arrangements (+24.1%), while fewer visitors purchased group tours (-9.8%) and package trips (-1.7%).
In December 2017, the Japan market recorded a decrease in visitor spending (-17% to $167.7 million) year-over-year. While visitor arrivals (+1% to 125,934) increased, the average daily spending was much lower (-17.7% to $220 per person).
Canada: Visitor spending (+8.1% to $1.03 billion) and visitor arrivals (+10.4% to 518,051) increased in 2017, as the market recovered from declines in both categories for much of 2016. Average daily spending dropped slightly (-0.7%) to $160 per person in 2017. Visitors spent more on entertainment and recreation, but less on lodging and food and beverage. Shopping expenses were similar to last year. Many more visitors stayed in rental homes (+23.5%) compared to 2016.
Visitor spending rose in December 2017 (+1.2% to $130.5 million) compared to December 2016. Visitor arrivals increased (+9.8% to 69,115) but daily spending declined (-9.1% to $147 per person).
[1] Total visitor spending of $16.78 billion was in nominal dollar (not adjusted for inflation) and did not include supplemental business expenditures.
[2] The number of jobs supported (direct, indirect and induced)
[3] Aggregate number of days stayed by all visitors.


